This is an old revision of the document!
Table of Contents
How Should We Initially Track Sprint Progress?
Premise
In general the best approach to tracking Sprint progress when you get started is through a manual big visible chart showing tasks moving through “To Do”, “In Progress”, and “Done” steps, and a chart showing the Sprint Burn-down, also manual. The reason we do this is so that teams can learn and understand how a Sprint is supposed to work without having to also learn the nuances (and potential changes in behavior) required by a tool.
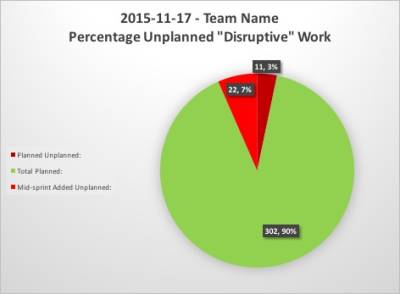
In addition, since many teams find that there is a constant stream of interruptions coming into the work of the Scrum Team, teams find it useful to keep a running total of the number of hours they are interrupted so they can start the process of managing the interruptions so they do not impact commitments and smooth flow through the Sprint (for example, by determining that many interruptions can be treat as “planned” events since the time between planning events is so short). Again, in the first instance this would be a simple paper chart on a wall somewhere.
In some cases this approach may not work. For example, you might your Scrum Team might have remote members in which case a physical board in a room will not work very well for those people. Or you might want to have others see the progress of this team who, again, don't have access to the physical space. At the same time, you don't feel you are ready to select a tool as part of the work. For these situations it is often easier to start with a simple Excel spreadsheet to start the process. Below please find such as spreadsheet.
Assumptions
There are a number of templates out there but I found that there were problems with a number of them, especially as a “starter” spreadsheet. Reason I have this one is:
- It focuses on what we need in the daily Scrum, while generating information for external folks
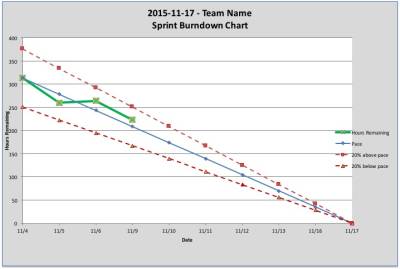
- It applies the idea of “acceptable range” of values which helps teams understand normal variation as opposed to “problems”.
- It does a couple of things well - burn-down progress and track interruptions. In particular it does not try to also be a Product Backlog (there is another sheet for that), just a Sprint Backlog.
- There are no macros so its straight forward to enter information, and as the team needs to make adjustments, means that we can add capabilities over time. Teams are expected to evolve and, in the early days, evolve quickly. This means that the tools they use will need to evolve quickly as well.
- Not much information is needed to get started.
- Idea of tracking where interuptions come from for a team is useful when getting started (note - if you do not have this problem, don't bother entering information in the related tab)
Sample Output
Burn-down Chart
Disruptive Work Chart
Template
Basic instructions are included in the spreadsheet on the “Instructions” tab. simple_sprint_backlog_and_burn-down.xlsx
~~LINKBACK~~ ~~DISCUSSION~~


