Table of Contents
Powerful Pictures
Premise
Sometimes seeing a picture really does help in understand. This page collects a number of pictures, graphs and charts that are scattered over the blog with links that help understand information about what they present.
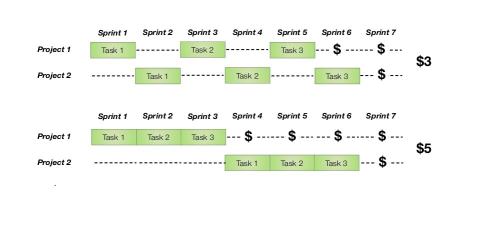
The Economic Benefit of Doing One Thing at a Time
See Why Should We Focus on Doing One Thing To Completion at a Time for more information.
Deliver Early to Improve Economics
See How Does the Agile Approach Allow Us to Deliver Early? for more information.
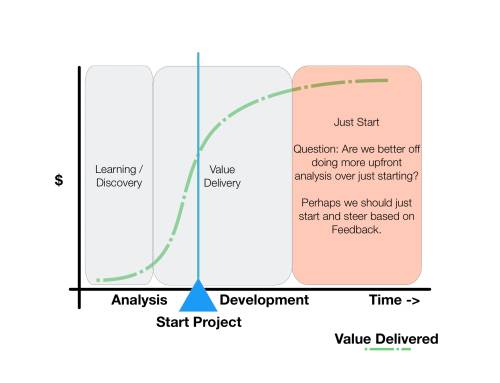
Start Early to Improve Economics
See Why Should We Start Without Doing a Complete Analysis? for more information.
Why (Near-)100% Utilization Actually Reduces Productivity
See What Is Wrong With 100% Utilization Thinking? for more information. The result is known as the Kingman’s Formula.
Why Large Batches of Work Actually Reduces Productivity?
See What Is The Effect of Batch Size On How Long It Takes to Get Something Done? for more information.
Why High Utilization Rates Make It Impossible to Create Good Estimates?
See Why Does High a Utilization Rate Make It Impossible to Create Good Estimates for more information.
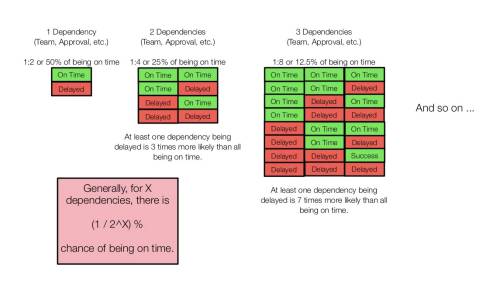
Why We Should Work Hard To Remove Dependencies
See Why Should We Work Harder to Eliminate the Effect of Dependencies? for more information.
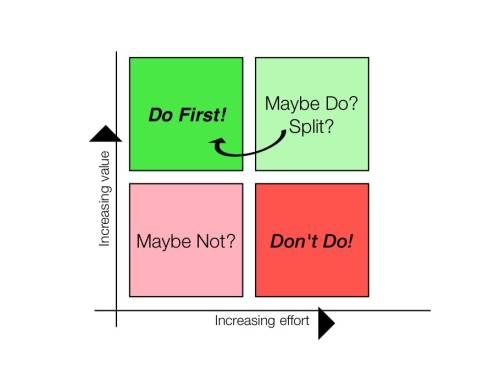
How Should We Prioritize Delivery of Value?
How Should We Engage with an Agile Coach?
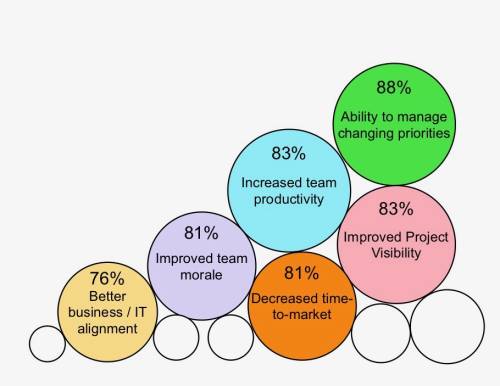
What Are the Benefits of an Agile Transformation?
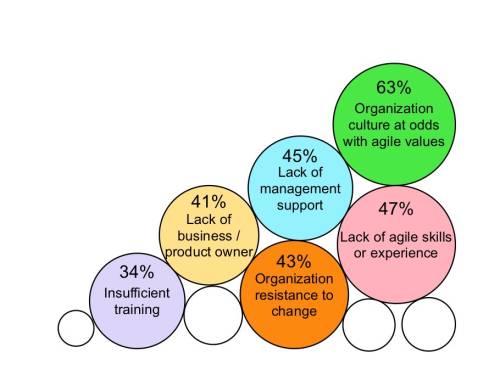
What Are The Challenges of an Agile Transformation?
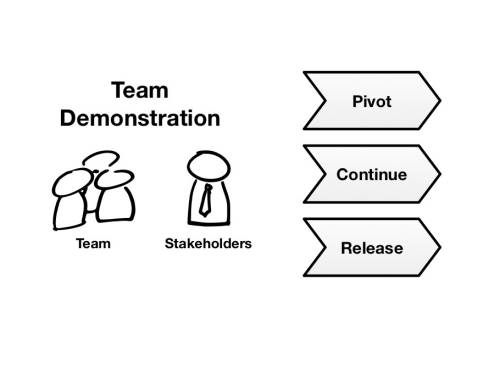
What Options do the Team Have When a Iteration Demo is Complete?
How Should We Break Down Requirements?
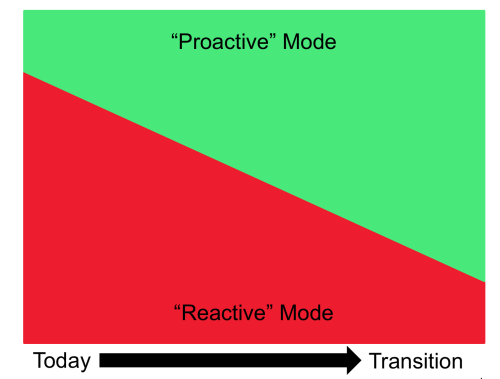
How Do We Move from Break-in to Planned Work?
See How Do We Deal With Constant Interruptions? for more information.
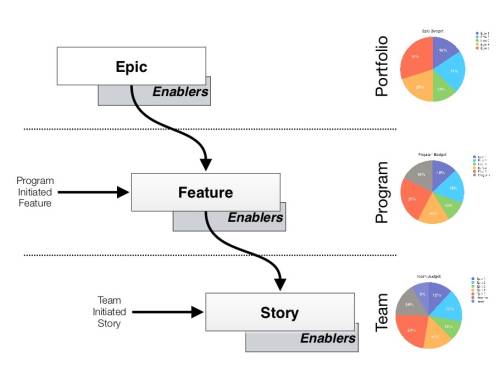
How Does Multi-tiered Product Management Work?
See How Does Multi-tiered Product Management Work for more information?

