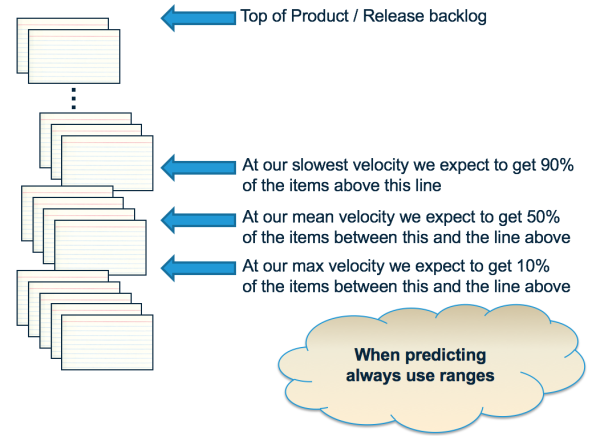
Why a Plan Based on Average Velocity Will Fail?
… on average and what should we do differently.
We've all seen the behavior. We learned that we should provide “ranges” of velocities when trying to forecast what is happening in the next Release. For a while we start out with good intentions. We use an average, and we use a “recent” minimum and maximum to frame what might happen in the future.

Then things change. We look at the “minimum” number and say to ourselves “well that number really doesn't make sense because no one is expecting the team(s) to operate so poorly again.” The same is true for the maximum number - no one believes it. We then decide that perhaps the average is the best indicator of what is going on.
So we plan to an average of recent velocities. This is where we start to see bad behaviors. Since we have a number that our plan is based on, we worry when the team doesn't do that number of points in the Sprint and decide to that we need to take action. In this way the “average” velocity becomes a target for the team. The team is seen as being “good” when they get more than the target, and “bad” when they do less.
Here's the what makes that thinking strange. When we have a plan based on averages, by definition we should expect the team to miss the velocity at least half the time. Think about it. An average basically means that 50% of the velocities this team will have are higher than the average (our “good” sprints) and 50% are lower (our “bad” sprints). This means we are rating teams as good or bad even though we should be expecting exactly what we see by good or bad luck alone, luck which the team can do nothing to control. Worse than that, our plan probably won't work out either.
Sam Savage called this the “Flaw of Averages”. It basically says that “a plan based on averages will fail, on average.”
The problem comes from our original thinking process. When we said “the team won't operate at this minimal pace again” we've actually throw away the data that said the team actually did operate at this pace, at least one time. Rather than throwing this information away, we should be using it. How do we use this information but give it the appropriate (rare) weight that?
Lets try working through an example. Say the velocity history of a team over the past 6 sprints is 20, 25, 23, 15, 30, and 27. We can say, based on this data that the worst this team could perform for the next 4 sprints is 4 times lowest number (15) for a total 60 points delivered. Again, we don't think this is likely, but it is possible. We can say the best this team could perform for the next 4 sprints is 4 times the highest number (30) for a total of 120 points delivered. Again not likely, but possible. The average of this sequence is 23.3 points which after 4 sprints would give a total of ~93 points delivered.
To get a more realistic forecast, what we really want to know is how many points the team will deliver in the next 4 sprints with (say) an 85% chance, not the around 50% chance the average gives us. How do we get to this 85% chance? What we can do is run through the same exercise that we have been doing, randomly selecting a velocity from the list of velocities we already have. So the next time we do this we might select a sequence of 20, 15, 20 and 15 for a total of 70 points delivered. Crappy sequence, but also possible based on the data we have. Another time we do the process and we get 30, 27, 23, and 27 for a total of 107 points delivered. The team's on fire, right! Not really, as the chance of this sequence is just as high as the crappy one above and could be due to good luck alone. Another time we get a different sequence, and another time and another time …
Each of these represents a possible future velocity history for the team. If we want to know the velocity a team will produce after 4 sprints, we run this process of generating a random sequence 500 times (say) and then see what velocity is produced by 85% of the runs.
OK, I hear what you are saying. Really? 500 times you want me to run this. And for every time I want to make a forecast. You've got to be kidding! Here is the good news. You can do it in a spreadsheet. Even better, Troy Magennis at Focused Objective has already created a spreadsheet for you called “Throughput Forecasting Tool” at “Sim Resources”.
When I enter the original sequence data into the spreadsheet, I get the following information:

You can see that the forecast says that we get 93 points if we are interested in a 50% chance of meeting our forecast plan (just like we said the average represented above). If you want an 85% chance of having a forecast plan come in, then you should use 83 as the number of points you expect to get in the next 4 sprints (weeks equated to sprints in this case).
Some of you will recognize this kind of analysis. Its called a “Monte Carlo Simulation”. It was invented in the 1940's to forecast aspects of the nuclear weapons program at Los Alamos. Since then it has been used in all kinds of situations where you want to forecast what might happen based on data you already have.
And it can be applied in situations where we want to improve our delivery forecasts as well. If you are interested in answering other questions about the future, Troy provides other tools as well.
