Table of Contents
How Do We Use Points to Estimate? - SSA
As many organizations move to an agile approach, many coaches recommend an estimation method called “Points” or “Story Points”. This approach differs from traditional approaches, and so causes discomfort to many, especially at the beginning. This note is about capturing the basics so that, if nothing else, we have a baseline of thinking.
What is the Purpose of Estimation?
We need to remind ourselves why it is we estimate. Let's face it, estimation is mostly about planning and forecasting. There is a huge amount of baggage in most organizations associated with the process of estimation. There are also legitimate questions the business has:
- When we will get this capability?
- How much will it cost to get this capability?
- Are we making progress to delivering this capability?
- What capabilities are coming up?
From the business perspective, the main reason for estimates is to provide data to the business (through the Product Owner / Manager) to understand, manage, and forecast plans. They are trying to make sure that, for a given capacity for the organization (enterprise, program, or team), we make trade-off decisions about how to best use that capacity based on the strategy we have and the need for self-investment, and then understand progress against these decisions. A secondary reason is to help the organization understand their capacity so they do not over-commit; so they can establish a sustainable pace.
Agile requires that we provide the business (through the Product Owner / Product Manager) with good enough data, that we work to improve the estimates when they do not provide the data required. In other words, when we say “make estimation work” what we mean is that the business can easily plan using the estimates and velocity and can make informed business decisions. If the business cannot make it work, it is up to the team / team-of-teams to help fix the problem.
The agile approach to estimation stresses speed, full team involvement, and information that is accurate enough for the purpose intended, not pure precision. This is aimed at reducing the burden of estimation, while still providing the data needed.
What Are The Problems with Estimation?
For many organizations, we need to be able to forecast. But, as Ron Jeffries says:
“Yes, estimation is fraught. It is inaccurate, and politically dangerous. But we do have some knowledge and the project deserves to have it.”
Estimates are not evil in and of themselves. But the results are often used for evil. Dilbert summarizes the traditional approach and the way we feel about it. Problems include:
- Estimates often become commitments and / or targets. People tend to treat these numbers as factual true data points instead of the probabilistic statements they are, with poor results.
- Estimates take a long time. Because we know the estimate is about to become a commitment, we almost do a complete design of the system in order to come up with an estimate.
- Estimates are wrong. Even after spending that amount of time on it, the estimates are wrong. And you'll find that the more time you spend on an estimate, the worse it becomes, mainly because you are building your estimate on assumption over assumption over assumption.
- Estimates are done by one group, or worse, by a single person. And so do not reflect the total view of what is required to do the work.
The agile approach to estimation is aimed at improving these outcomes.
Are There Any Benefits to the Team of Estimating?
While the initial benefit to the Team of estimating is in understanding their capacity to deliver value, there are in fact other benefits of estimating to the Team:
- Clarity: Teams understand the type of work they do and what the market is asking for. They can ask clarifying questions to make acceptance criteria detailed enough for them implement the work. Through discussion as a result of estimation there is increased clarity for the whole Team.
- Knowledge transfer. Team members explain the actual work helping the whole Team learn cross functional knowledge which, when coupled with paired work, prepare them to execute new skills on their own. As Teams participate in the estimation process, each skill set brings their viewpoint to the discussion, thus building a common understanding of the need and the work involved. Sure the person doing the change might think it is a simple change, but the person with the testing background might understand that there is a wider impact.
- Reduced batch size: Estimation helps us forecast work. But what is interesting is that Teams quickly discover (as they analyze the success of their estimation) that the smaller the work, the more predictable their ability to deliver. So the process of estimation actually works to encourage smaller batches of work. Teams will start to establish team norms to say, for example, “if a story takes is expected to take more than 1/2 a week, we need to split it.”
I like this quote from Steve McConnell:
“The point of estimation is not to predict the future but to understand if we are even within a chance of managing our way to success.”
The business view of this “chance” is the forecast use of capacity. The Team / Team-of-Teams (Train) view of this is to work to their capacity.
What is the Basis of Our Estimating Process?
The basis of the estimating process is “Team based relative size estimates” or “Story Point estimation” to estimate User Stories (the need). This means:
- We do relative size estimates (how big something is in relation to something else), not duration estimates (how long something takes).
- We use a team based approach to estimation such as planning poker or affinity (or triangulation) estimation
- We have the people (in other words “the Team”) doing the work doing the estimates
- We use the modified Fibonacci sequence (1, 2, 3, 5, 8, 13, 20, 40, 100) for estimating
- All data we collect can and should be used to understand what and how we are doing so that we can get better.
- The estimation process is refined. Estimations are revisited to see if they are accurate and precise enough.
Relative Estimates
If two work items are the same size, should they always have the same estimate?
It is worth delving into the notion of a relative size estimate for a moment. Most traditional estimates are based on duration (“it will take about 20 hours”), and that leads to a whole bunch of problems (see What Are The Problems with Estimation? for more information). But it is worse than that. If you have two pieces of work to do, both of which you think will take about 20 hours to complete, but the first piece of work is straight forward, while the second is in an area where there is a traditionally a lot of problems, should these items have the same estimate? No, you'll probably want to put some level of buffer in place to offer a more realistic estimate for the second piece of work. This is another reason to move away from pure, absolute time based estimates.
One thing that often confuses people who are used to traditional task based estimates is that the resultant estimate is a Team's view of how big this item is. When we say the estimate is a “3”, we are really saying that the Team's view of this piece of work is that it is a “3”. In particular, it is not a single Team member's view. When starting, many Teams fall into the trap of saying “There are design, implementation, and testing components of this piece of work. George will do the design so what do you think the estimate is for the design piece … Jenny will implement, so what do you think the estimate for the implementation piece is …” and then just sum up the results. In Agile the unit of execution is the “Team” and so the estimates indicate the size of work for the Team not the individuals on the Team. Sure the time to “design” and “implement” are part of that. But to deliver the value represented by the Story the Team might, for example, want to pair implementation and testing as they do the design to improve the design. Or the Team might find that testing might need an “all hands on deck” approach to assure quality. What we are estimating is the Team's ability to deliver value.
In Agile the unit of execution is the “Team” and so the estimates indicate the size of work for the Team not the individuals on the Team.
For more information on the basis of the process see Planning Poker for Estimates from Mike Cohn. Affinity mapping is based on Play, Pass, or Move approach.
What Are the Characteristics of a Good Estimate?
Estimates need to reflect reality. Some basic characteristics of what we need from estimates include:
- The estimates consistently reflect the capacity of the Team to deliver.
- The estimates consistently reflect the size of the work no matter what kind of work it is. For example, it should not matter that we are estimating a new feature or defects.
- They are truly relative in that, on a Team by Team basis, an 8 is an 8, and an 8 is about 4 times a 2 no matter the source.
- Estimation data allows the use of ranges of estimates to help understand the risk profile of the work. A simple example of this is when the Product Owner uses best, average and worst velocities to understand what is likely to happen with their plan.
It is worth saying again:
The estimates consistently reflect the capacity of the Team to deliver.
They must be based on reality.
Why Do We Use Story Points Instead of Hours or Days?
Story Points should be used instead of absolute hours because people are naturally better at relative estimation. Relative estimation with story points:
- Take less time,
- Provide enough accuracy and precision for organizations and Teams to forecast and plan,
- Can scale from individual Teams to Team-of-Teams and Portfolios.
But Story Points are not equal to hours. A lot of people like to equate hours or days with Story Points. Sometimes this is because there:
- Is a misunderstanding of what Story Points are, or
- Is starting guidance we get when first doing estimates, or
- Are Teams that have small, well known, low complexity work where they actually know how many hours it takes them to implement.
If, for example, you are using SAFe, and have never done the Story Point approach before, SAFe introduces the idea of standardizing points where “the shared understanding of 1 story point 'is '~ 1 day of effort to develop & test a story'”. This ensures we were able to do reporting at higher levels by rolling up numbers. SAFe also establishes the initial Velocity for the Team by multiplying the number of people on the Team (not including PO and SM) by 8 (days) and then adjusting the result down by subtracting the number of days that people would not be available during a Iteration. The training material indicates that this was a starting point.
The problem is that many people are still using this understanding when estimating Stories by saying things like “a day is equals a point and so since this item is about 10 days, the estimate is 10 points”. They then fudge the number to an 8 or 13 because “we are only allowed to use the Fibonacci numbers.” This is not the intent, and if you head in this direction there is no benefit to using Story Points.
To be clear, if the estimate is really just a proxy for time (hours or days), we should stop calling them Story Points. After all, they are just “ideal days” or “ideal hours” with all the inherent problems. Daryl Kulak says:
If a development team is equating some number of hours to a storypoint, it is missing the point (pun intended). Saying, “Thirty hours equals one point” is ridiculous. If you’re doing that, just use hours for goodness sake. You haven’t gained anything from storypoints except to be able to claim to be doing “agile.”
Here are some things to understand when using Story Points instead of a more traditional approach to estimating.
Story Points and Velocity
Team Velocity is expected to increase over time as the Team learns how to deliver value more effectively. If this is grounded in time-based estimates, you cannot expect Velocity to increase as the reality is that there is only so much time available in a two week period (80 hours, right?). Velocity numbers usually increase over time as the Team learns how to work together more effectively and so their effective capacity increases.
Story Points Are More Than Size
Sure, “how long” you expect something to take is part of the estimate, but you also want to factor in risk / uncertainty, and complexity. For example, if the work looks like it will take the Team a day to do, but there is a lot of risk involved, then the Team might want to give a higher (not 1) estimate – say a 2 or a 3. If the duration is expected to be 8 Team days, and it is low risk and complexity, the Team might consider the estimate to be an 8, or the Team might say “we are rubbish at estimating week long efforts so let’s give it a 13 to address this uncertainty.” In this example the 13 hopefully leads to a discussion about splitting the story to improve its chances of delivery.
Story Points Need a Baseline
Estimates should be relative to something; a known piece of work. Start with a 1 sized piece of work (about a day, low risk, low complexity, and low uncertainty) that the whole Team can understand. Then, as you do other estimates the Team talks in terms of “in comparison to this 1 sized piece of work, I think this is about 3 times bigger, so this is a 3.” Perhaps you also identify another sized piece of work, say a common understanding of an 8 sized story. Having an understanding of two different sized stories will help the Team triangulate the estimate for any new stories – “its bigger than this 1 sized story, but smaller than this 8 sized story so it a …” Some Teams call these known stories their “keystone” stories.
Estimation is Unique to Each Team
Each Team will have a different view of the factors that contribute to “medium risk” but within a Team they will have a shared understanding. So one Team might say “if it involves new screen then, at a minimum, it is an 8 because we need to work UX issues, work closer with the customer, …” Another team might have UX expertise and so this may not be a reason to differentiate for that team. But they may have an approval process that seems to slow things down, so stories that have this approval step are larger. Each team will have a different view of the factors that effect “size” of work for them.
Estimation is Continually Refined
Over time, as Teams do more estimating, the Team will start to build up a table in their heads:
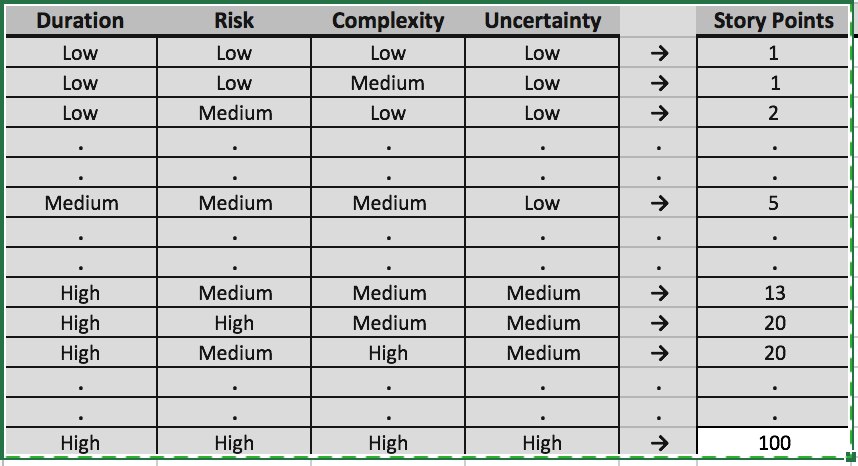
This chart is an example of how teams develop their view of “size.” The Team that developed this chart had specifics about what they thought size meant, including complexity and risk. I sanitized it for the article. So, for example, for this Team “risk” meant “known risks” while “uncertainty” was “unknown unknowns” (and there was more of this the further out the work was.) In their minds it was not the same thing. To be clear if your Team formalizes the development of a chart like this, their chart will look different based on the work, your Team’s make-up, etc.
What is really cool about estimating this way is that you will establish a stable Team velocity over time which will help the Team make and meet commitments. As you determine future work, you can rely on the historical velocity of the Team since the numbers already factor in different risk, complexity and uncertainty profiles.
How Should We Update Our Estimates?
Or “When Should We Update Our Estimates?”
Old habits dies hard. One of the interesting things that happens when we estimate using Team based Story Point estimates is that once the work is complete, Teams want to update the estimate based on what they know now, and so “improve” the estimate.
This is a mistake.
The reality is that no amount of additional planning would have resulted in a better estimate. In fact the evidence indicates otherwise; estimates get worse the more time you spend on it (mainly because you are building guesses on top of guesses as you think longer about the problem). It is simply wrong to “blame” the estimate for the fact that there is now more work than expected. The only way you could have found this out was by doing the work, getting the feedback from the customers. (See Our Estimates are Terrible! for an example of this kind of thinking)
What this tells you is that you should not update a record of the estimate once you have started real work on it. That way an estimate stays an estimate, and has the same basis (and is good as) as any other estimate that we have in the system. Using this basis we can compare all the estimates, safe in the knowledge that they have the same status - “we haven't start working on this yet”.
There is nothing wrong with collecting information about how much effort something actually takes; just don't call that an “estimate” as it represents what “actual”ly happened.
What does this mean in a practical sense? Lets take a Story as a starting point. Associated with this Story should be a field which stores the “estimate”. The estimate is filled by the Team as a result of their favorite estimation method. The “actual” field for the Story is currently “null”. The estimate can be refined while the Team is not doing the work associated with the Story:
- Perhaps a related piece of work provided additional data that can inform this work.
- Perhaps there was increased clarity associated with the acceptance criteria.
- Perhaps we invested in some enablement work that will make this work easier.
- Perhaps ….
All these things might necessitate an update to the Story estimate.
Now the Team starts working the Story. Perhaps they committed to it during Iteration (Sprint) Planning. The Team is decomposing the work, determining who does what etc. At this point you should not update the “estimate” for this Story any more. As you complete the work, you might update the “actual” field.
This kind of thinking applies the higher level structures (Epics / Features) as well.
The basic rule is that you shouldn't update the estimate once you have “started work” on it so you can look at all the data in your (Portfolio / Program) backlog with a single understanding of the status of the work effort - its a guess / no work. How you determine what it means to “start work” on an Epic or Feature will probably require some discussion since it may not be as clear cut as the Story / Team example.
How Can We Scale Our Estimating Approach Beyond a Team?
Often, you need to provide estimates for items of work that are beyond the size of a typical Story, say an Epic or a Feature. For example, you might want to determine an overall road-map of intent and need to line that up with a calendar. This is only realistic if you have some kind of view of how long something will take. Or you might want to determine the Cost of Delay, which includes a sizing component in it, to determine what work you should schedule first to maximize the return.
The question therefore is “How do you go about getting size information for these bigger pieces of work?”
For the sake of discussion we are going to make a couple of assumptions:
- We are going to use the basic SAFe structure of Stories (less than two weeks), Features (less than a quarter), and Epics (more than a quarter). While the discussion is related to SAFe, there is nothing SAFe specific here. The scaled estimation problem is the same.
In general there is a different focus in the “why we estimate” question as we scale to epics and features. At the team level you are interested capacity to take on work. At the program level the main use is to prioritize the work. At the portfolio level its to help with overall budgeting. Pictorially this is represented as:

(Note: Thanks to Steve Sanchez for the graphic.)
There are two basic ways to scale estimates:
- Pure Feature and Epic points which are used as an estimate: With this approach you use a similar process that you would use with Story Points. In other words you would use Team based relative size estimate on Features and Epics to generate “Feature Points” or “Epic Points”. You might choose to define a new scale so that it is clear you are talking about Feature Points or Epic Points. For example, Feature Points might be 10X a Story Point, with a sequence that looks like 10, 20, 30, 50, etc. In the same way that you track Team Velocity to determine how much you can get done, you can track closure of Features and Epics to reflect how much you can get done in these scaled environments.
- Pros: In many ways, this approach is a "fractal" of the story point approach and benefits in a similar way.
- Cons: The main downside of this approach is that it will take time to get useful (in terms of forecasting) data. Just like a Team has to wait an Iteration (a couple of weeks) to get their first data point, Features will take a quarter to get their first real data point and Epics will probably take longer still. Another weakness is if one class of work is significantly different from others it is difficult to get consistent estimates and capacity based on feature velocity.
- Summated Story Points to create Feature and Epic estimates: Based on a common understanding of the size of a Story Point, the idea here is that Features are estimated in terms of the number of Story Points it would take to complete the work, and similarly for Epic. So for example, if we look at a Feature and as we do the estimating we would say “this Feature is about the same amount of work as this other 60 Point Feature, so we'll call this a 60 for the estimate.”
- Pros: One benefit of this approach is that you can start using data immediately. If, for example, you want to start managing Epics at the portfolio level now, you can quickly create estimates and understand capacity even if you do not have all the teams in place. The data you will have, while not highly accurate, will be sufficient to do capacity calculations and prioritization (see How Do I Facilitate a Prioritization Meeting? for an idea on how to get started).
- Cons: The main downside of this approach is that you need to have a common understanding of a Story Point. Many start with “a day equals a point” with the result this can quickly turn into a pure duration based estimate with all the problems that entails. Another problem occurs when one Team's velocity is significantly different (ie orders of magnitude different) from other Team's as, while each of the Teams can work their own estimates and velocity, when you summate very large numbers from one Team they can completely swamp other Team's numbers which means it is hard to understand capacity of the multi-Team Train.
In practice, the two approaches really are not that far apart from each other. What you will find is that even with the summated approach, you will end up with Features in the 10's (ie 10, 20, etc) and Epics in the 100's. The hard part is getting people to really do relative size estimates that include a view of risk and complexity at all levels. As a general note SAFe starts with the “Summated Story point” approach, but it is not that specific over the long haul. In fact SAFe assumes a relative size approach (not duration) as it says “Start with day is a point then never look back”.
What this means is that in most places I have worked, organizations end up with the Pure Feature and Epic Points approach where Feature Points are the Fibonacci numbers times 10 (10, 20, 30, …, 130) and the Epic points are the Fibonacci numbers times 100 (100, 200, 300, …, 1300). The other thing that organizations do is limited the highest number to 13 or 20, no 100’s etc, with the idea that this encourages people to split the work up if it gets to this level. So if there is a Feature Point estimate of “this is more than 130”, the discussion is “Perhaps this is an Epic? Or perhaps we need to split the work so that it will fit in a quarter.” This is a good discussion to have.
One final note on this. Many organizations I've worked with like to abstract estimation one step further by using t-shirt sizes for estimates. For many it is easy to say “in comparison to this small piece of work, this is a large”; it helps because since there are no numbers, you don't think about time. Once they have the t-shirt size, organizations usually settle on a mapping between these t-shirt sizes and Feature or Epic points. The following diagram shows a sample mapping that might be put in place:

Note that the mapping and the numbers would be validated to ensure that there is in fact a meaningful mapping between a feature we call “small” and the actual story points needed to complete that feature.
One final note. Some organizations I’ve worked with step back from an either or approach and work a both and approach. When little is know about the Feature, say when it is still being analyzed, they use a Feature point scaling based on S, M, L t-shirt sizing. They then equate the t-shirt size to numbers, so a S might be a 3 Feature Points, M might be 8, and so on. Then, as they learn more and understand the kind of work they have they move to a summated story point approach to Feature size; a second estimate, if you like.
Want to Know More?
- Why the Fibonacci Sequence Works for Estimating - Weber’s Law approach from Mike Cohn
- Why Progressive Estimation Scale is So Efficient - Information theory approach from Alex Yakyma
How Do We Use Story Point Estimates To Forecast?
Team Velocity
We have Team based Story Point estimates. How can this information be used to forecast work?
Let's start with the simplest case first. Have a look at the following picture:

On the left you see a prioritized backlog of work in User Stories where the items in that Backlog all have Story Point estimates on them. The Team selects the set of work they think they can deliver in the next, say, 2 week period to form the “Iteration” or “Sprint” Backlog. Here the Team has selected the first 4 Stories. The estimates for these Stories are 3, 5, 8, and 5.
What the Team is saying at this point is that they think they can complete 3+5+8+5, or 21 Points of work in this 2 week period. If at the end of the 2 week period the Team actually delivers this set of work, then the 21 Points is the Team Velocity. We say “the Team's Velocity is 21 Points for this Iteration.” What this really is saying is that your Team can deliver 21 Points of User Stories in an Iteration. This is a measure of Team capacity to deliver value.
What is a good guess for how much the Team can deliver in the next Iteration? We know they can do 21 points, so we might want to use that data to say “They can deliver 21 Points in the next Iteration”. And 21 after that, and 21 after that … You get the idea. If we have a prioritized Backlog with estimates we can now forecast how many Iterations it is going to take to deliver however much of the Backlog we are interested in. (Note: This estimating approach is called “Yesterday's Weather” - What is a good guess for the weather tomorrow? Whatever it was today.)
But what happens if the Team does not deliver the whole 21 Points. Perhaps they deliver on the first three items, but miss the fourth item. One of the basic philosophies of agile is that we only record “progress” when we complete work "Working software (solutions) is the primary measure of progress". If the Team has not completed the work of the fourth item, then we should not count it in the Team Velocity. The Velocity in this case would be 3+5+8, or 16 points. And, of course, the information we use to forecast should change as well. After all, the Team was not able to do the 21 Points they originally thought. A good guess for the next Iteration, based on the data we have now, is 16 and so on going forward.
Of course the reverse is also true. The Team might have completed the 21 points before the end of the Iteration. They taken on another Story. They think “Looking at the Backlog, the 13 is too big to do with what remains of this Iteration, so is the 8, but perhaps we can take on the 3.” If they take this on and complete the work, what is the Team's Velocity? We completed 3+5+8+5 + 3, so the Team Velocity is 24 Points and we can use that information for forecasting.
The reality is that Teams do not produce the same Velocity every Iteration. Sometimes they do more. Sometimes less. Over time Teams typically get better as they learn how to work together. Every couple of weeks there is another data point. So a Team might see:
| Iteration | Velocity |
|---|---|
| 1 | 21 |
| 2 | 24 |
| 3 | 20 |
| 4 | 30 |
| 5 | 28 |
The Product Owner should leverage this information in their forecasts. A typical approach is to use three data points - the minimum, the average, and the maximum - to be more informed about the forecast. So here the minimum is 21 Points, the maximum is 30, and the average is around 24-25. We can use this information with our prioritized backlog:
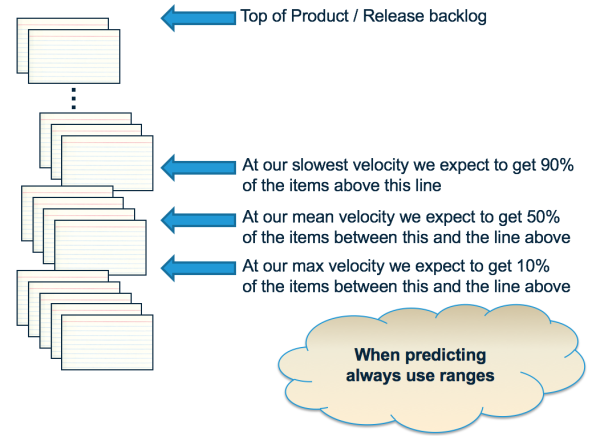
The way to think about this is to look at the items between the average and maximum Velocity - these have a significant risk of not happening based on current knowledge. If you see things there that are a significant problem, then these need to be worked now. Perhaps we need to re-prioritize the Backlog to bring in the items of concern. Perhaps we need to find another Team to do the work. Perhaps …
Many people worry “But what if we get the estimates wrong?” Here's what is interesting about the approach. If we had guessed (OK, estimated) the set of items above as 5+8+13+8, instead of 3+5+8+5, and we completed this work in the iteration. Instead of a 21 point Velocity, the Team now has a 34 point Velocity. If we assume the rest of the data in the Backlog has a similar bias (a pretty good assumption), and guess 34 points for the next Iteration, then … it will produce about the same number of items in the forecast. In other words, this approach to estimating is self-correcting with respect to the forecast. That's not to say that you don't have to work to improve estimates (see What Can We Do To Improve Our Point Based Estimates?), but rather there is less concern here than at first blush.
Note that some people worry that this isn't enough data to be significant. It may not be in a statistical sense, but it is sufficient for our purposes in that it is recent and current. And the reality is that you often have more data than you think - see How Can We Forecast When We Do Not Have a Lot of Data? for more information.
How Do We Scale Forecasting?
It should come as no surprise that the scaling for forecasting the data takes a similar approach to the approach we take when scaling the estimating approach beyond a Team.
To create a Team Velocity, we need to have Estimates on the Stories, and we needed a time-box (2 week Iteration) at which point we measure the amount of “done” work. The Team Velocity is the sum of the Story estimates completed in the 2 week period.
We have estimates against the Features and the Epics, whether via pure Feature / Epic Points or via Summated Story Points. If we decide we want to understand the capacity of a team-of-teams (Train) organization to deliver Features, all we need to do is determine the time-box to measure this over. Most organizations settle on some kind of quarterly cadence. To calculate the Train Velocity, sum up the estimated Feature Points completed in the quarter. Lets say we get a value of 500 Points. This means the Train can deliver 500 Points of value per quarter - a good indicator for the capacity of the Train for the future.
Similar thinking can be applied to Epics at the Portfolio level.
How Do We Deal with Carry-Over Features?
If we are in the first quarterly increment (SAFe's Program Increment or PI) 1 and we find that we have not completed work on a Feature, what should we do with that Feature as we head into PI 2. In general, what we would like to do is determine whether it is better to work on new PI 2 Features, or finish off the remaining amount of work on the Feature from PI 1. To do this “correctly” need to determine whether it it better to invest our capacity in the remaining work on the Feature or to stop and work on new Features. This means, for the purposes of scheduling the carry-over Features, we need the “job size” to reflect remaining work when doing the WSJF calculation. This will have the natural effect of moving unfinished work higher because you'd expect it to be smaller. If we only have a couple of hours left on something and we get “all this value” then we should do this first.
This thinking is really an example of:
“what is the best use of our people’s time?“
In reality re-estimating the Features can be a lot of work and the end result is often “we need to finish the Features we have started.” Most organizations end up saying that “we will treat Feature carry over work differently”. Let's say we have some uncompleted Features in the current PI, PI 1. Rather than re-estimating the Feature for work that is carried over, we will simple treat carry-over work as “top priority” and assume that it will be scheduled first. These become the top items on the list for PI 2. Then the only thing we do a WSJF on is “new” PI 2 stuff that is coming out of the Program Backlog.
If you do this process, you would want to do a quick review of the carry over work asking “have we learned something that would say we shouldn’t just finish the work of this feature in the PI?” You are looking for things that still have a lot work to complete. For example:
- Perhaps you have an item that actually was never started in the PI 1, or only had a small amount of work completed, leaving a lot.
- Perhaps now that we have done the work in the PI 1 we find that that the remaining work is “another PI or 2” to complete.
These items should not be treated as carry-over but rather should be compared (WSJF) to all the other PI 2 items coming in to determine if they really are the most important things to work on in PI 2.
Similar thinking can be applied to Epics at the Portfolio level.
How Do We Show Progress of Work for a Feature or Epic?
Requirements typically are represented in an organization as a hierarchy: Epics breaking down into a number of Features, Features into a number of Stories:

This structure is typically reflected in the work management tool you have. So Stories will be parented by Features. Features by Epics. You can then show completion of Features and Epics by showing the Story Points completed versus the Story Points still to be completed. The follow chart is an example showing progress toward completing an Epic:

Notice that the amount of work we have associated with the Epic goes up as well as down. This is expected. As we do the work, we learn more and more about the business need and how we address that need. Sometimes this means we identify additional work to do; sometimes it means we can reduce the amount of work to do. This is the point of agile - scope is not fixed - and we will evolve our plan by continuously re-planning the work based on what we know today.
Where Did This Estimation Approach Come From?
Ever wondered where the story point / relative sizing based estimating approach came from. A lot of the thinking is based on the “Wideband Delphi” estimation method, a consensus-based technique for estimating effort. This, in turn, was derived from the Delphi method which was developed in the 1950-1960s at the RAND Corporation as a forecasting tool. It has since been adapted across many industries to estimate many kinds of tasks, ranging from statistical data collection results to sales and marketing forecasts.
In addition, it turns out there was significant amount of research into doing estimates, since this was considered such a core part of the software development process. The result is that this estimation approach has been validated by that research.
Looking at the approach:
- Those that do the work, estimate the work (1)
- Estimators are required to justify their estimates (2, 3)
- Focus most estimates within one order of magnitude (4, 5)
- Combining individual estimates through group discussion yield better estimates (6, 7)
The numbers refer to the following references:
- Jørgensen, Magne. 2004. A Review of Studies on Expert Estimation of Software Development Effort.
- Hagafors, R., and B. Brehmer. 1983. Does Having to Justify One’s Decisions Change the Nature of the Decision Process?
- Brenner, et al. 1996. On the Evaluation of One-sided Evidence.
- Miranda, Eduardo. 2001. Improving Subjective Estimates Using Paired Comparisons.
- Saaty, Thomas. 1996. Multicriteria Decision Making: The Analytic Hierarchy Process.
- Hoest, Martin, and Claes Wohlin. 1998. An Experimental Study of Individual Subjective Effort Estimations and Combinations of the Estimates.
- Jørgensen, Magne, and Kjetil Moløkken. 2002. Combination of Software Development Effort Prediction Intervals: Why, When and How?
And if you've ever wondered why we use the modified Fibonacci sequence instead of some kind of simple 1 to 10 scale, see Why Progressive Estimation Scale Is So Efficient For Teams.
In addition, this approach leads to:
- Emphasizing relative rather than absolute estimates, which means that you can estimate very quickly. People are very good at deciding whether something is bigger or smaller than something else (relative size estimates), but are terrible at determining how big it is (absolute estimates). You will often see Teams that can produce 20, 30 even 40 estimates in an hour with improved data and far less wastage associated with the process.
- Estimates are constrained to a set of values so that we don’t waste time on meaningless arguments.
- Everyone’s opinion is heard.
- Its fun! (or at least more fun than the old way)
You will also note that these references are quite old, so there really is no surprise that people continue to learn and experiment with different approaches. The reason I bring this up is that there are alternative approaches out there.
What Alternative Estimation Approaches Are There?
The traditional approach to estimation is based on team relative size estimates is backed by research. The approach has proven to improve outcomes associated with estimation, but that does not mean this is the only estimation approach we can use.
Alternative approaches include:
- #noestimates approaches: there is a lot discussion about this thinking and the discussion is worthwhile. See Do We Need Points To Generate a Release Burn-up Chart? for this type of thinking.
- Cycle time and throughput: More generally, using cycle time and throughput information directly can help.
- XP based: 0, 1, 2, 4, split. Used to help encourage smaller pieces of work.
- High / low estimates: The approaches generate a single number to estimate size of a Story. When forecasting the future we should be talking about a range of possible values rather than a single number as the future is not certain.
- Probabilities: A more rigorous approach is to use actual probabilities to talk about what might happen. See Why a Plan Based on Average Velocity Will Fail? for the thinking here.
- Dependencies: Estimation approaches that directly factor a understanding of dependencies to drive better information. See Why Should We Work Harder to Eliminate the Effect of Dependencies? for some thinking here.
- Expansion: Estimation approaches that also factor in expansion of scope, since in most cases scope increases rather than decreases, as the team implements and the customer sees what is possible.
- Utilization / WIP: Understanding the impact of high utilization on estimates. See Why Does a High Utilization Rate Make It Impossible to Create Good Estimates? for more information.
Organizations can and should improving their process to so that they produce the least amount of wasted effort in return for the information gained.
Want to Know More?
General ideas:
- https://www.youtube.com/watch?v=MrIZMuvjTws: Video on how to run a planning poker session.
SAFe also talks about estimating:
- Baseline for Estimation: https://www.scaledagileframework.com/story/
- Iteration planning: https://www.scaledagileframework.com/iteration-planning/