This is an old revision of the document!
Table of Contents
Powerful Pictures
Premise
Sometimes seeing a picture really does help in understand. This page collects a number of pictures, graphs and charts that are scattered over the blog with links that help understand information about what they present.
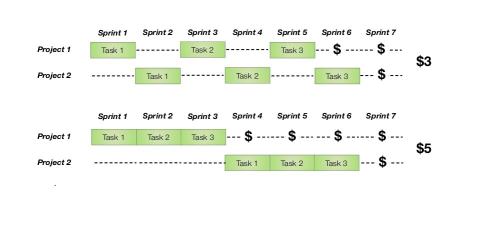
The Economic Benefit of Doing One Thing at a Time
See Why Should We Focus on Doing One Thing To Completion at a Time for more information.
Why (Near-)100% Utilization Actually Reduces Productivity
See What Is Wrong With 100% Utilization Thinking? for more information.
Why Large Batches of Work Actually Reduces Productivity?
See What Is The Effect of Batch Size On How Long It Takes to Get Something Done? for more information.
Why High Utilization Rates Make It Impossible to Create Good Estimates?
As you increase the utilization rate of people, the amount of time it takes to complete something on average increases, and after about 80% increase dramatically. If you are trying to estimate work and you have a high utilization rate, then which number would you use - the one represented at the lower end of the curve, or the one at the high. The difference is “orders of magnitude” on the estimate.
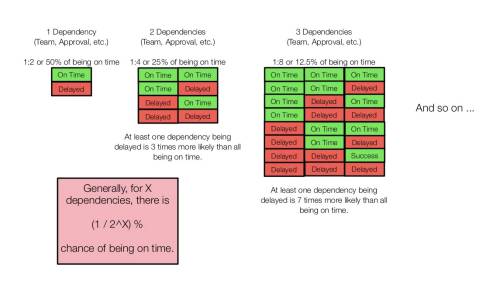
Why We Should Work Hard To Remove Dependencies
See Why Should We Work Harder to Eliminate the Effect of Dependencies? for more information.
~~LINKBACK~~ ~~DISCUSSION~~


